

Why Your Meta Ad Creatives Are Burning Out (And How to Build a Testing System That Learns)
Time is the one variable no algorithm can optimize for - it’s the silent killer of even the best creative. While most teams scramble to extinguish CPL fires, elite growth leads build systems that replace the wood before it even gets dry.

Mirhayot Yunusov
Co-Founder at Eloqwnt | LoloPepe

The CPL was $88 in week one. By week four it was $124. By week seven it was $163. Nothing changed in the account. Same audiences. Same bid strategy. Same campaign structure.
The growth lead looked at the dashboard and saw the same audience, the same bids, and the same settings. But the CPL was climbing like it was on a mission to hit the moon. The account wasn't broken. It was just tired. Time is the one variable no algorithm can optimize for - it's the silent killer of even the best creative.
THE FATIGUE CYCLE
Meta ad creative fatigue in B2B follows a predictable pattern: launch → peak performance (days 1 - 7) → plateau (days 7–21) → fatigue onset (days 21 - 35) → CPL spike. Early warning indicators: frequency exceeding 3.5, hook rate declining week-over-week by 0.3 - 0.5 percentage points, CPL rising 10 - 15% over 5 consecutive days.
What Creative Fatigue Actually Is
Creative fatigue is the degradation of ad performance caused by audience overexposure. When the same creative runs against the same audience long enough, three things happen in sequence:
- Recognition replaces response. Your audience's brain is a highly efficient filter. The moment they recognize your ad, they've already 'swiped' it mentally before the thumb even moves. It’s like hearing a joke for the fifth time - it’s not that it’s not funny, it’s just that you already know the punchline. Recognition is the enemy of response.
- The algorithm exhausts responsive segments. Meta’s delivery algorithm shows the ad to the most likely responders first. After those segments have been exposed multiple times, the algorithm has to reach less-responsive segments to maintain delivery volume. Cost per result rises as the audience quality of each additional impression decreases.
- CPL spikes as a lagging indicator. By the time CPL rises significantly, the fatigue has been present for days or weeks. CPL is the last metric to move - by which point the damage is already done.
Understanding this sequence is important because it changes the intervention strategy. If you wait for CPL to spike before acting, you are reacting to the last signal in the chain. A proactive testing system acts on the first signals - frequency and hook rate decay - before CPL moves.
The Fatigue Cycle: The Four Stages
Creative burnout is a mechanical process with a clear data signature, allowing you to pinpoint exactly when a "hero" ad begins to fail before the financial damage hits your dashboard.
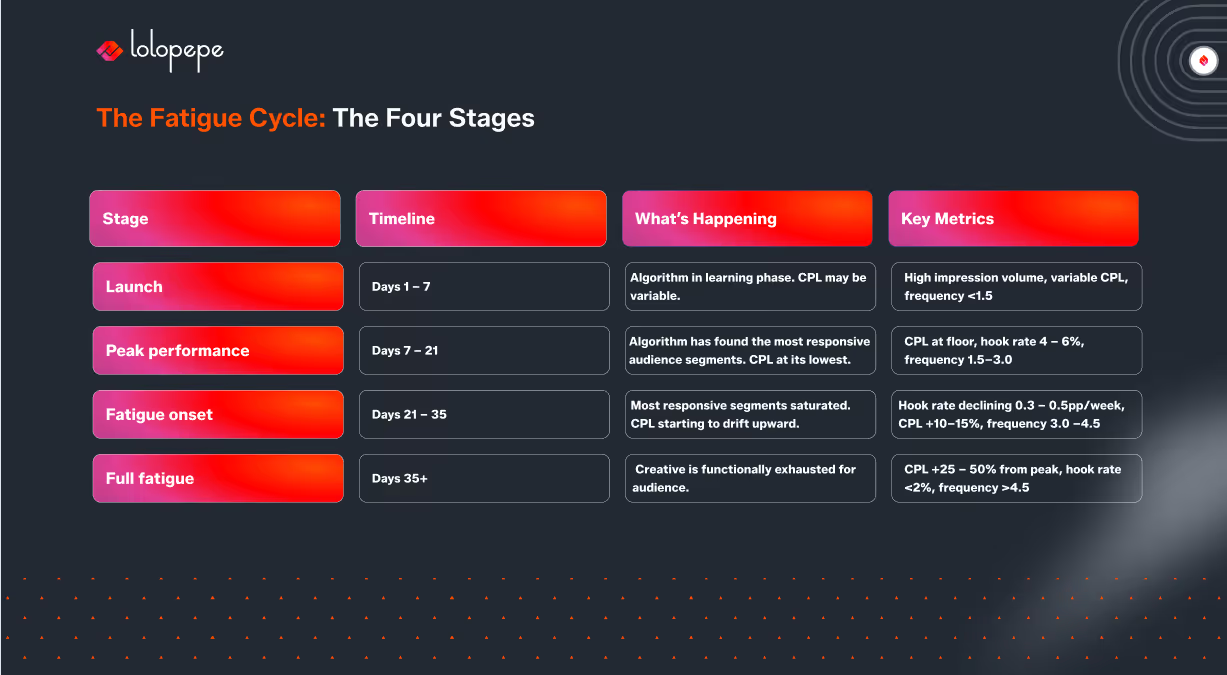
The transition from Stage 2 to Stage 3 is the critical intervention window. Acting at Stage 3 onset prevents the Stage 4 CPL spike entirely. Acting at Stage 4 requires rebuilding from a degraded baseline.
The Early Warning Data Signature
The Stage 3 fatigue onset has a specific data signature that appears 7-10 days before CPL spikes. Most teams miss it because they are looking at CPL - the lagging indicator - rather than the leading indicators.
Leading indicator 1: Frequency threshold. Frequency (average impressions per unique user) crossing 3.5 for cold audiences is the earliest reliable fatigue signal. At this point, the average user in your target audience has seen the ad 3.5 times. The marginal response rate of additional impressions is declining rapidly.
Are you running a campaign, or are you just managing a decline? If your frequency is over 3.5 and you’re still 'watching' the data, you’re not monitoring - you’re just spectating your own budget burn
Leading indicator 2: Hook rate decay. A consistent week-over-week decline in hook rate (scroll-stop rate) of 0.3 - 0.5 percentage points with no creative changes indicates audience recognition is overriding engagement. The hook that stopped the scroll in week 1 is now being filtered before it can register.
A declining hook rate is your campaign’s flare gun. It’s the algorithm’s way of saying, 'I'm running out of people who care about this angle.' If you ignore the flare, don't be surprised when the CPL bomb drops a week later.
Leading indicator 3: Hold rate decline with stable hook rate. If hook rate holds but hold rate (3-second view rate for video) declines, the audience is stopping on the ad from habit or recognition but not engaging with the content. This is a subtler fatigue signal specific to video creative.
Lagging indicator: CPL rise. A CPL increase of 10 - 15% over 5 consecutive days with no targeting or bidding changes confirms that fatigue is in progress. At this point, new creative should already be in production - not in brief.
The intervention rule: when two leading indicators are present simultaneously, new creative should be in production. Not briefed. In production.
Why Most Teams Respond Too Late
Most teams live in a state of 'firefighting.' They wait for the CPL to explode before they even reach for the creative brief. It's the path of least resistance, but it's also the most expensive. By the time you notice the smoke, your campaign budget is already halfway to ashes. We don't wait for fires, we build a system that replaces the wood before it even gets dry.
The structural problem is that most B2B advertising teams do not have a continuous creative production pipeline. They produce creative in response to performance problems rather than in anticipation of them. This reactive model guarantees that every creative fatigue event produces a CPL spike - because there is never new creative ready to deploy at the moment fatigue signals appear.
The proactive model inverts this: creative is always in production, always being tested, always cycling in new variants before the current control fatigues.
The testing system runs on a cadence that is faster than the fatigue cycle. At 15 tests per month, you are refreshing creative every 2 days on average. At a 21 - 35-day peak performance window, you never exhaust a variant before its replacement is already validated.
Think of testing velocity like a gym habit. You don't get results from one intense workout. You get results from the consistency of every sprint. 15 tests a month is the cardio that keeps your CPL lean and healthy.
The Testing System That Learns
A testing system that prevents creative fatigue has four operational components:
1. Fixed sprint cadence. New creative variants produced every 7-14 days, on schedule, regardless of current CPL. The sprint cadence is not triggered by performance problems - it runs continuously. This ensures there is always new creative in the pipeline.
2. Hypothesis-driven production. Every new variant tests a specific hypothesis based on Learning Log data from the previous sprint. Not “let’s try something different” - “we believe a pain-point hook will outperform our current benefit-statement hook based on last sprint’s hook rate data.” The system learns because every test produces documented learning that informs the next brief.
3. Control + challenger structure. The current best-performing creative (the control) always runs alongside new challenger variants. The control is never paused until a challenger has validated performance equal to or better than it. This prevents the “creative gap” that occurs when fatigued creative is paused before a replacement is validated.
4. Fatigue monitoring dashboard. Frequency, hook rate, and CPL tracked weekly. When two leading indicators cross threshold simultaneously, the next sprint is accelerated. The dashboard converts passive monitoring into active production decisions.
Building a Proactive Refresh Schedule
A proactive refresh schedule is built around the fatigue timeline, not the CPL trend. Here’s how to structure it:
- Establish the baseline. In the first 7 days of any new creative, document: CPL, hook rate, frequency. This is the performance baseline against which fatigue will be measured.
- Set threshold alerts. Configure dashboard alerts for: frequency >3.5, hook rate declining >0.3pp week-over-week, CPL rising >10% over 5 days. These alerts trigger production acceleration, not campaign pausing.
- Run a continuous production sprint every 14 days. Regardless of performance. New brief, new variants, new hypotheses. The sprint produces 3 - 5 challenger variants that enter the rotation alongside the current control.
- Retire fatigued creative deliberately. When a creative crosses the full-fatigue threshold (frequency >4.5, CPL >25% above peak), retire it formally. Document in the Learning Log: how long it ran, what its peak metrics were, what triggered retirement. This data informs future creative longevity predictions.
- Never run a single variant. Always maintain 3 - 5 active variants in rotation. When one fatigues, the others absorb its budget while a replacement is produced. The CPL spike that comes from running a single fatigued creative is eliminated by portfolio diversity.
Mini Case Study: CPL Before and After Systematic Testing
A B2B SaaS company in the HR tech space was running a single ad creative per campaign, replacing it reactively when CPL crossed $180. Their average CPL over 6 months: $156. Their peak CPL during fatigue events: $210 - $230. Two CPL spikes per quarter.
After implementing a biweekly sprint cadence with 5 variants per sprint:
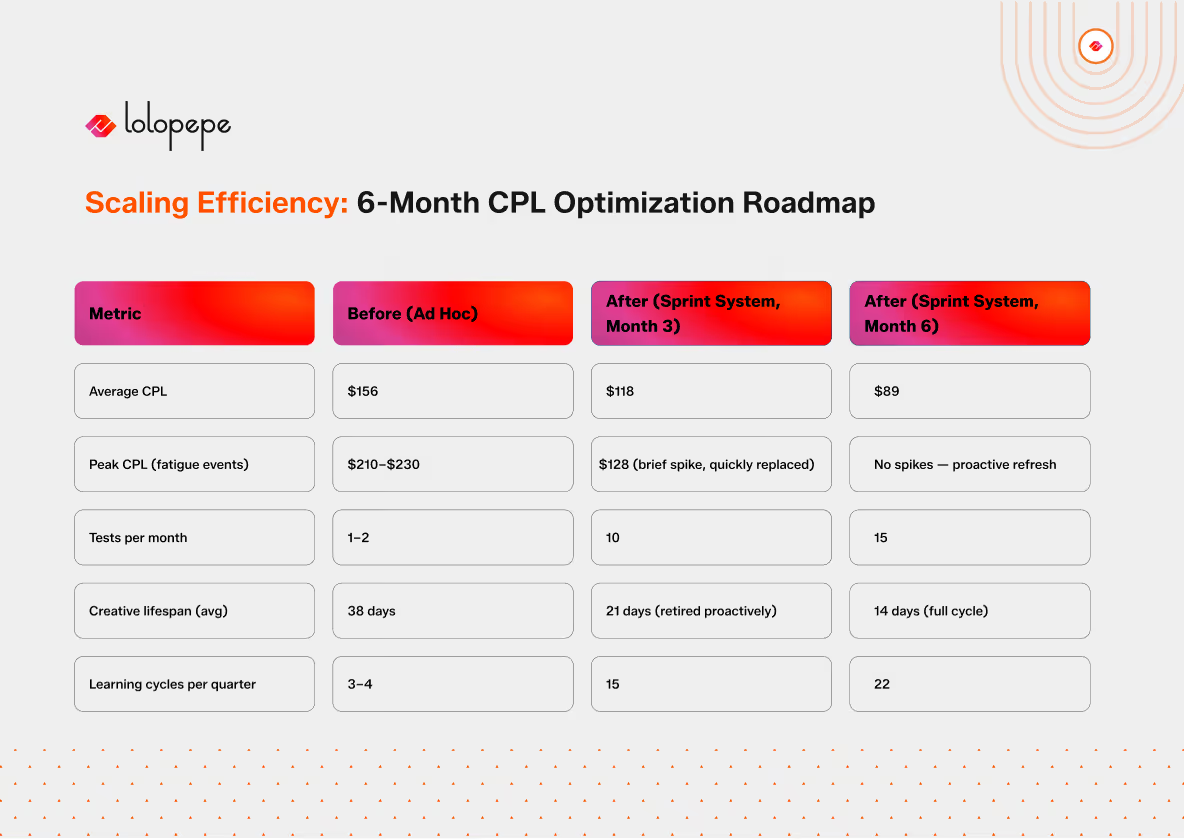
The CPL reduction from $156 to $89 over 6 months was not driven by better creative talent. The team was the same. It was driven by a system that produced more tests, learned from each one, and never allowed a single fatigued creative to run unchallenged.
Frequently Asked Questions
Q: How do I know if my CPL rise is from creative fatigue or from external factors like seasonality or increased competition?
A: Look for the "fatigue signature": if CPL climbs alongside rising frequency and dropping hook rates on specific ads, it’s fatigue. External factors like seasonality hit the whole account at once. If some ads still perform while "high-frequency" ones fail, the problem is definitely the creative, not the market.
Q: How long does a well-produced B2B Meta creative typically last before fatiguing?
A: For a $5k - 15k monthly spend, expect 21 - 35 days for cold audiences and 35 - 50 days for retargeting. Video usually outlasts static images, but hyper-targeted ICP messaging fatigues faster because you’re fishing in a smaller, quicker-to-saturate pool.
Q: Should I pause fatigued creative or just add new creative alongside it?
A: Never pause before you have a winner. Launch your "challengers" alongside the fatigued "control," wait 7 days for data, and only then redirect the budget to the validated replacement. Pausing early creates a "creative gap" that spikes CPL even harder than the fatigue itself.
Q: What’s the minimum ad spend to run a proactive testing system effectively?
A: You need $5,000 - 10,000/month to get enough data (500+ impressions per variant) for reliable decisions within a week. If you’re at $3k - 5k, just slow down: run 3 variants instead of 5 and extend your testing window to 10 - 14 days. The logic stays the same, only the velocity changes.
The Bottom Line
Creative fatigue is a clock ticking in the background of every campaign. You can either play "firefighter" and scramble when costs explode, or be the strategist who’s already deployed the solution before the first alarm bells ring. In the Meta ecosystem, victory doesn't go to the deepest pockets, it goes to the team that learns the fastest.
Are you truly monitoring your growth, or just spectating your own budget burn?
A system that cycles through 15 variants a month doesn't just manage burnout - it makes it irrelevant. By the time your current "star" creative hits its ceiling, its successor has already been battle-tested and is ready to take the lead. Stop reacting to spikes and start outrunning them.
Download the Creative Fatigue Early Warning Checklist - a one-page reference with threshold values for frequency, hook rate decay, and CPL delta, plus the production trigger rules for each.
Or get a Free Creative Audit: send us your current Meta campaigns and we’ll tell you exactly where in the fatigue cycle each creative is.
Mirhayot Yunusov
Co-Founder at Eloqwnt | LoloPepe
Mirhayot builds design-led ventures that make impact. He specializes in turning subjective intuition into scalable Brand Operating Systems that empower Series A+ companies to ship daily.
Through his articles, Mirhayot shares the design thinking, strategic frameworks, and creative decisions behind building brands that look and feel like leaders. Whether it's brand systems, web design, or motion his insights are built from real work with real companies.
Subscribe to our newsletter.
Get valuable strategy, culture, and brand insights straight to your inbox.