

Creative Data Analysis for B2B: What Metrics Actually Matter (Beyond CTR)
Most B2B teams are making million-dollar iteration decisions based on a 1.2% CTR that tells them absolutely nothing about why their creative actually failed. This guide strips away the vanity metrics to reveal the four-metric diagnostic engine you need to turn cold data into a high-velocity growth lever.

Mirhayot Yunusov
Co-Founder at Eloqwnt | LoloPepe

The weekly report landed in the performance marketer’s inbox on Monday morning. CTR: 1.2%. She stared at it. Is that good? Is it bad? Should she change the creative? Should she leave it alone? You know something is wrong, but the data isn't telling you where to find the smoke. The number sat there, cold and unhelpful. It was like looking at a fuel gauge that says 'half full' while your engine is making a sound like a bag of wrenches.
CTR - click-through rate - is the default primary metric for B2B ad creative performance. It is also one of the least actionable. A 1.2% CTR tells you that 1.2% of people who saw your ad clicked it. It does not tell you why the other 98.8% didn’t. It doesn’t tell you whether the problem is the hook, the copy, the offer, or the visual. It doesn’t distinguish between a creative that stopped the scroll and failed to convert and one that never stopped the scroll at all. It compresses the entire creative performance story into a single ratio that cannot be acted on.
The metrics that actually drive B2B creative iteration decisions are different. Here they are - what each one measures, what benchmark it should hit, what it tells you when it misses, and how to build a dashboard that turns all four into a direct input for your next sprint brief.

THE FOUR METRICS THAT MATTER
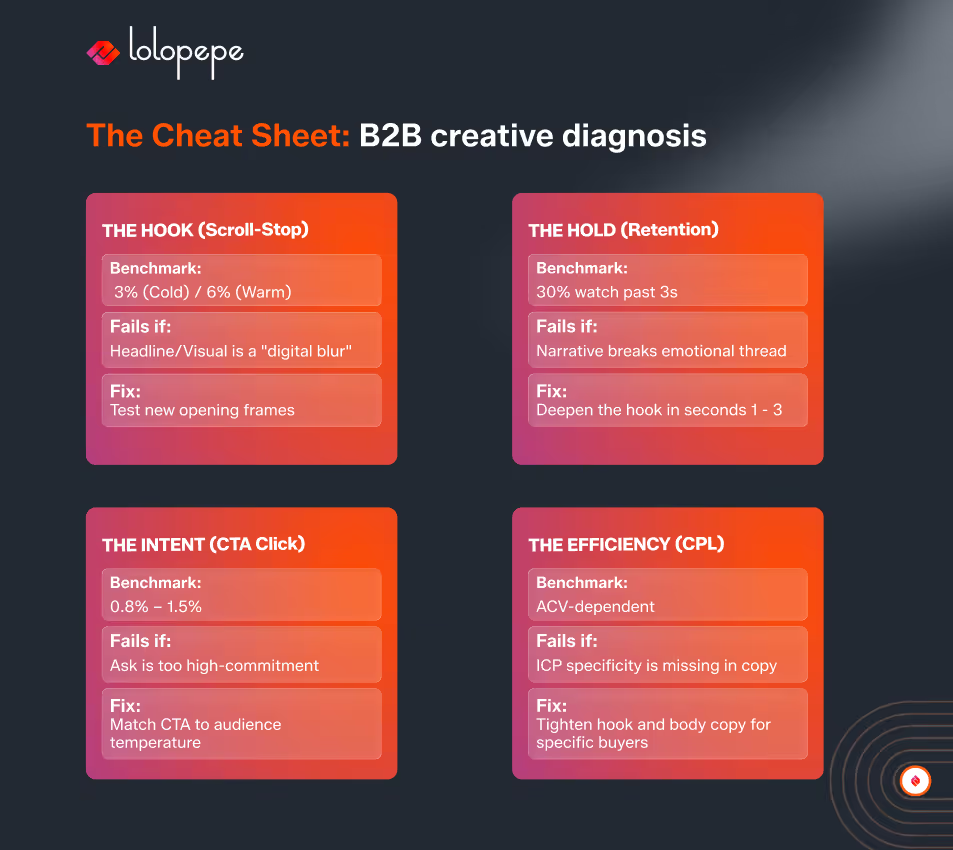
(1) Hook rate - scroll-stop performance | (2) Hold rate - attention retention | (3) CTA click rate - conversion intent | (4) CPL - acquisition efficiency
Each metric diagnoses a different creative failure point. A dashboard built on these four replaces CTR as the primary iteration signal.
Focusing only on CTR is like judging a blind date solely by whether they showed up. It’s a start, but it tells you nothing about whether the conversation was good or if there’s a second date in your future.
Why CTR Is the Wrong Primary Metric
CTR conflates two distinct creative performance events: the scroll-stop decision and the click decision. These events are separated by the entire creative experience - the hook, the visual, the copy, the offer, the CTA. Collapsing them into a single ratio destroys the diagnostic value of both.
Consider two ads with identical CTRs of 1.1%:
- Ad A has a hook rate of 8% (lots of people stop scrolling) but a CTA click rate of 0.4% (very few of those who stop actually click). The hook is working. The copy or offer is failing.
- Ad B has a hook rate of 2% (few people stop scrolling) but a CTA click rate of 1.8% (most of those who do stop end up clicking). The hook is failing. The copy and offer are strong.
Both ads have a 1.1% CTR. They have opposite creative problems. CTR cannot tell you this. The four-metric framework can.
The Four-Metric Creative Funnel
B2B creative performance follows a sequential funnel. Each stage is a conversion event with a measurable rate. Each rate has a benchmark. Each rate below the benchmark indicates a specific failure point.

The funnel is sequential: you cannot have a high CTA click rate without first having scroll-stop. You cannot have a low CPL without first having qualified clicks. Diagnosing creative performance means identifying where in the funnel the conversion rate drops below benchmark - and that is the stage your iteration should focus on.
Metric 1: Hook Rate (Scroll-Stop Rate)
Hook rate is the percentage of people who stop scrolling when they encounter your ad. On Meta, this is approximated by the 2-second video view rate divided by impressions (for video) or by thumb-stop rate where available. On LinkedIn, it is approximated by engagement rate on the first visible element.
What it tells you: Whether the first frame of your video or the headline/visual of your static is sufficiently relevant or unexpected to interrupt the scroll. Hook rate is determined almost entirely by the first 1.7 seconds of experience.
Below benchmark diagnosis: Hook rate below 3% (cold) means the first frame or headline is not creating an immediate reason to stop. To your audience, your ad is just another digital blur. They aren't 'ignoring' you - they just haven't been given a reason to care in the 1.7 seconds they gave you before moving on to something better. The fix is the hook, not the rest of the creative.
Iteration signal: Low hook rate → test new opening frames (video) or new headlines/visuals (static). Keep everything else constant. The variable being tested is specifically: does this hook stop scrolling for this ICP?
Hook rate improvement is typically the highest-leverage creative iteration for new campaigns. A creative that stops scrolling 6% of the time generates 2x the raw attention of one that stops scrolling 3% - at identical ad spend.
Metric 2: Hold Rate (3-Second View Rate)
Hold rate applies to video creative only. It measures the percentage of people who watched past the 3-second mark - the point at which the algorithm considers a view intentional rather than accidental.
What it tells you: Whether the opening narrative of your video is delivering on the promise of the hook. A high hook rate with a low hold rate means the hook stopped the scroll but the first 3 seconds failed to justify continued attention. The hook overpromised, the opening underdelivered.
A high hook rate with a low hold rate is like throwing a massive party where everyone shows up, but realizes there are no drinks and the music is terrible. You’ve successfully opened the door, but you’ve given them zero reasons to stay in the room.
Below benchmark diagnosis: Hold rate below 30% with adequate hook rate means the transition from hook to opening narrative is breaking down. Common causes: the hook addresses a pain point but the opening immediately pivots to product features (breaking the emotional thread), or the visual quality drops sharply after the hook frame.
Iteration signal: Low hold rate → test revised opening narratives (seconds 1 - 3) that maintain the emotional or problem-framing momentum established by the hook. The first 3 seconds should deepen the hook, not redirect it.
Metric 3: CTA Click Rate
CTA click rate is the percentage of people who clicked the specific call-to-action element - the button, the link overlay, or the headline link - rather than total link clicks (which includes accidental clicks and profile clicks).
What it tells you: Whether the offer and friction level of the CTA are appropriate for the audience’s temperature. A high hold rate (people watched) with a low CTA click rate means the creative held attention but the ask was too high-commitment for the audience’s current relationship with the brand.
Below benchmark diagnosis: CTA click rate below 0.8% (cold) with adequate hold rate indicates one of three problems: 1. the offer is not compelling enough to justify the click. 2. the CTA commitment level is mismatched with audience temperature (asking cold traffic for a demo booking. 3. the CTA copy is generic (“Learn More”) rather than specific (“See the Framework”).
Iteration signal: Low CTA click rate → test CTA copy variants and commitment level. For cold audiences: reduce friction (“Get the Framework” vs “Book a Demo”). For warm retargeting: increase specificity (“Start Your $750 Sprint” vs “Learn More”).
Metric 4: CPL and Lead Quality
CPL (cost per lead) is the acquisition efficiency metric - the total cost of generating one qualified lead. It is the output of the three preceding metrics: hook rate determines reach efficiency, hold rate determines attention efficiency, and CTA click rate determines conversion efficiency. CPL synthesizes all three into a single acquisition cost.
What it tells you: Whether the complete creative is producing leads at an efficient cost. CPL is the metric most directly tied to business outcomes - it translates creative performance into a number the CFO can evaluate.
Lead quality as a CPL modifier: A low CPL with poor lead quality (high volume, low lead-to-demo rate) indicates the creative is attracting the wrong audience. The ICP specificity of the hook and body copy is insufficient - it is generating clicks from people who are not qualified buyers. Lead quality should be tracked alongside CPL: CPL ÷ lead-to-demo rate = cost per demo, which is a more accurate acquisition efficiency metric.
Iteration signal: When CPL climbs despite strong engagement, the issue usually lies in offer relevance or CTA conversion. If lead volume is high but quality is poor, your hook and copy likely lack ICP specificity. Conversely, a low CPL paired with declining quality signals creative fatigue - your ad is starting to attract clicks from the wrong crowd
Creative Fatigue Indicators: The Early Warning System
Most marketers wait for the CPL to skyrocket before they realize the creative is dead. By then, you’ve already burned two weeks of budget on a ghost.
Creative fatigue is the silent killer of B2B campaigns. It’s that moment when your audience develops 'banner blindness' and your once-hero creative starts to feel like yesterday's cold coffee. Most teams identify fatigue after CPL has already risen 20 - 30% - well past the optimal intervention point.
The early warning data signature for creative fatigue:
- Hook rate declining week-over-week by 0.3 - 0.5 percentage points while impression volume holds steady
- Frequency exceeding 3.5 for cold audiences or 6.0 for warm retargeting audiences
- CPL rising 10 - 15% over 5 - 7 consecutive days with no targeting or bidding changes
- Hold rate declining while hook rate holds - indicates the audience recognizes the hook but has stopped engaging with the content
The intervention point is when two of these four signals appear simultaneously. At that point, new creative variants should be in production - not in brief. If you wait for CPL to rise 30% before briefing new creative, you will experience 2 - 3 weeks of elevated CPL while production catches up.
Building the Dashboard: How Metrics Inform Iteration Decisions
A functional dashboard doesn't require complex software - a structured table in Notion or Google Sheets is enough to convert numbers into concrete steps for your next sprint. Instead of just collecting data, use this diagnostic protocol to audit your metrics every 7–14 days:
- Hook Rate (Scroll-Stop): If your rate is below 3% (cold) or 6% (warm), your visual is just digital noise. The Fix: Test new opening frames or headlines in the next sprint.
- Hold Rate (Attention Retention): If fewer than 30% of viewers watch past the 3-second mark, you’re losing attention immediately after the "hook". The Fix: Rewrite the script for seconds 1–3 to deepen the interest.
- CTA Click Rate (Conversion Intent): A rate below 0.8% indicates a weak offer or a barrier to entry that is too high. The Fix: Test the button copy and lower the commitment level (e.g., "Get the Framework" instead of "Book a Demo").
- Lead Quality (ICP Fit): If your CPL is on target but the lead-to-demo conversion is below 18%, you are attracting the wrong audience. The Fix: Add more ICP specificity to your hook and ad copy.
- Fatigue Tracking (Early Warning): If frequency exceeds 3.5 and CPL rises for two consecutive weeks, the creative is officially "fatigued". The Fix: Immediately refresh ad variants to avoid a sharp spike in lead costs.
The result of this audit shouldn't be a presentation, but a data-driven brief for the next sprint. Instead of making assumptions, you state: "We are testing new hook structures next sprint because our Hook Rate was 2.1% against a 3% benchmark".
Frequently Asked Questions
Q: Where do I find hook rate and hold rate data in Meta Ads Manager?
A: Meta doesn’t give you these by default - you have to build them. For the Hook Rate, manually create a custom column dividing "2-Second Continuous Video Views" by impressions. For Hold Rate, divide "3-Second Video Plays" by those 2-second views. If you’re running statistics, use "Post Engagements" over reach as a proxy. Pro tip: Save this as a custom column set so you don’t have to play "find the metric" every Monday morning.
Q: What’s the difference between CTR (link) and CTA click rate?
A: Think of CTR (link) as a messy catch-all; it counts every accidental thumb-slip, profile click, and "see more" expansion. CTA click rate is the pure stuff; it tracks only intentional hits on your primary button. On mobile, your link CTR can be 40 - 60% higher just due to "fat finger" errors. If you want to make smart iteration decisions, ignore the noise and follow the intentional intent of the CTA.
Q: How many data points do I need before a metric is statistically reliable?
A: Don't perform surgery on a campaign after three hours of data. You need a solid baseline: 500+ impressions for Hook Rate, 200+ views for Hold Rate, and at least 20 leads for CPL. In a typical B2B spend of $3k–$10k, you’ll hit these "truth thresholds" in about 5 - 7 days. That’s exactly why our sprint window is 7 days - it’s the minimum time needed for the data to stop lying to you.
Q: Should I track these metrics for organic LinkedIn content too?
A: Absolutely, though the tools are a bit more "analog". For Hook Rate, watch your "Impressions vs. Unique Impressions"- if the ratio is too high, you’re just preaching to the choir instead of stopping new scrolls. For Hold Rate, look at the "Click-to-impression" ratio on long posts. It’s less about surgical precision and more about diagnosing exactly where your audience decided to look away.
The Bottom Line
Data shouldn't just be a post-mortem of why your budget died. It should be the diagnostic tool that helps you perform surgery on your creative funnel in real-time. CTR measures the output of the creative funnel. Hook rate, hold rate, CTA click rate, and CPL measure the funnel itself - each stage separately, with benchmarks that tell you specifically where creative is working and where it isn’t.
A performance marketer working from a dashboard built on these four metrics makes better iteration decisions faster than one working from CTR alone. Not because they are more analytical - because they have the right inputs.
Download the Creative Analytics Dashboard Template - a pre-built spreadsheet with metric columns, benchmark thresholds, fatigue indicators, and an iteration decision output field for each sprint.
Start your $750 Trial Sprint today - we’ll build your high-velocity creative engine in 7 days.
Or get a Free Creative Audit: run your current live metrics through the four-metric framework and see where your creative is breaking down.
Mirhayot Yunusov
Co-Founder at Eloqwnt | LoloPepe
Mirhayot builds design-led ventures that make impact. He specializes in turning subjective intuition into scalable Brand Operating Systems that empower Series A+ companies to ship daily.
Through his articles, Mirhayot shares the design thinking, strategic frameworks, and creative decisions behind building brands that look and feel like leaders. Whether it's brand systems, web design, or motion his insights are built from real work with real companies.
Subscribe to our newsletter.
Get valuable strategy, culture, and brand insights straight to your inbox.