Creative ROI: The Calculation Framework Finance and Marketing Can Actually Agree On
Defending creative spend with engagement metrics loses to budget pressure every time. We bridge the gap between marketing and finance with a formula connecting production to closed revenue.

Mirhayot Yunusov
Co-Founder at Eloqwnt | LoloPepe

In most boardrooms, marketing and finance speak two different languages. Marketing speaks in adjectives - 'viral,' 'engaging,' 'premium.' Finance speaks in arithmetic. When the CFO asks, 'What did this put in the bank?', they aren't being difficult; they're looking for a bridge between your creativity and their ledger. This guide is that bridge.
DEFINITION
Creative ROI is calculated by dividing the net revenue attributable to creative assets by the total cost of producing and distributing those assets, expressed as a percentage. Hard ROI includes direct revenue attribution; Soft ROI accounts for CAC reduction, pipeline velocity, and brand lift - all of which carry calculable financial value.
Why Creative ROI Is Hard to Measure - and Why Most Teams Stop Trying
Three structural challenges act as the 'fog' of B2B attribution. To see the numbers clearly, you first have to understand why the default tools keep you in the dark.
Multi-touch attribution complexity. A B2B buyer in 2026 encounters 6 - 10 brand touchpoints before converting. A LinkedIn post, a retargeting ad, a nurture email, a case study download - each plays a role. Last-touch attribution undervalues content dramatically. First-touch overvalues awareness. The reality is a weighted multi-touch model that most teams haven't built.
Long B2B sales cycles. Enterprise deals close in 60 - 180 days. The organic content that warmed a buyer in Q1 contributes to a deal closing in Q3. Standard 30-day reporting windows make this invisible - which creates systematic undervaluation of content that's actually working.
Soft ROI invisibility. The trust built by thought leadership content, the reduction in sales cycle length from warm inbound versus cold outbound, the close rate uplift from buyers who already understand your positioning - none of this appears in ad dashboards. But it has real, calculable financial value.
Most teams encounter these challenges and conclude that creative ROI is unmeasurable. That's the wrong conclusion. It's measurable - just not with the default tools most marketing teams use.
Hard ROI vs. Soft ROI: The Full Picture
Creative ROI has two components. Both matter. Only calculating one gives an incomplete picture - and typically results in systematic undervaluation of your content investment.
Hard ROI - Direct Revenue Attribution
Hard ROI covers revenue directly attributed to creative assets through a traceable conversion path. This is the number finance is most comfortable with because it connects marketing spend to revenue in a verifiable sequence.
HARD CREATIVE ROI FORMULA
Hard ROI (%) = [(Revenue Attributed to Creative − Total Creative Cost) ÷ Total Creative Cost] × 100 Where Total Creative Cost = production cost + ad spend (distribution) + management overhead Note: Most teams only count ad spend in 'Total Creative Cost.' Including production and management gives you the true CAC-aligned figure finance will trust.
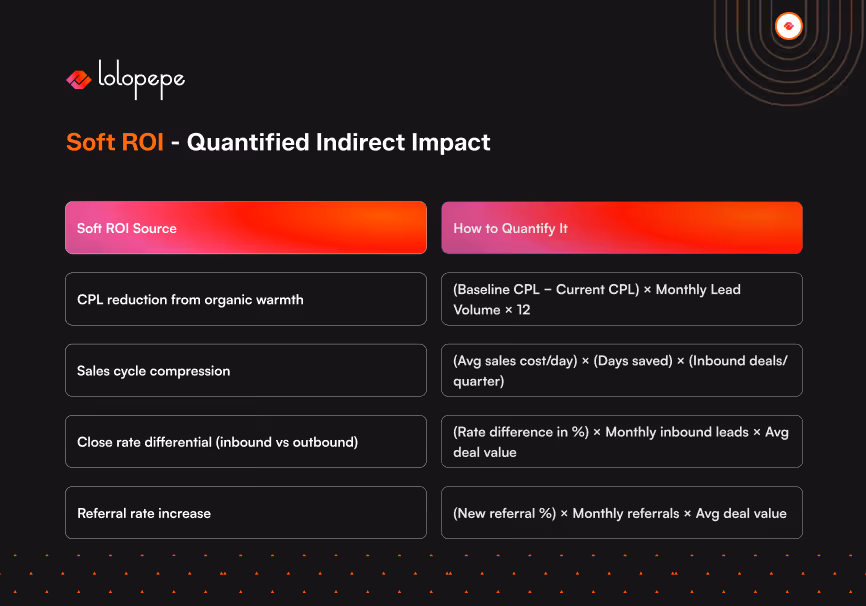
Soft ROI - Quantified Indirect Impact
Soft ROI isn’t 'vague' ROI - it’s quantified efficiency. It’s the financial value of trust. If a prospect closes faster because your content did the heavy lifting, that’s not a soft metric; it’s a hard asset for your pipeline velocity.
The Creative ROI Calculation Framework: Step by Step
- Establish your cost baseline - document every cost: retainer/production fees, ad spend, internal team time (hours × blended rate), tool costs. Use a 90-day minimum window for B2B given sales cycle length.
- Tag revenue sources in your CRM - every lead and every deal should have a source tag: paid creative, organic content, referral, outbound. Without clean source data, attribution is guesswork. If tagging isn't in place, implement it now and run the analysis from the implementation date forward.
- Apply the right attribution model - for program-level reporting: use linear attribution (credit distributed equally across touchpoints). For campaign optimization: use last-touch. For awareness content ROI: use first-touch. Pick one model per use case and use it consistently.
- Calculate hard ROI by source - run the formula for each major creative channel: paid performance creative, organic content, email. Combine into a blended creative ROI figure for the CFO report.
- Quantify and add soft ROI - use the table above to calculate each soft ROI source with actual numbers. Present as 'verified indirect contribution' - not speculation.
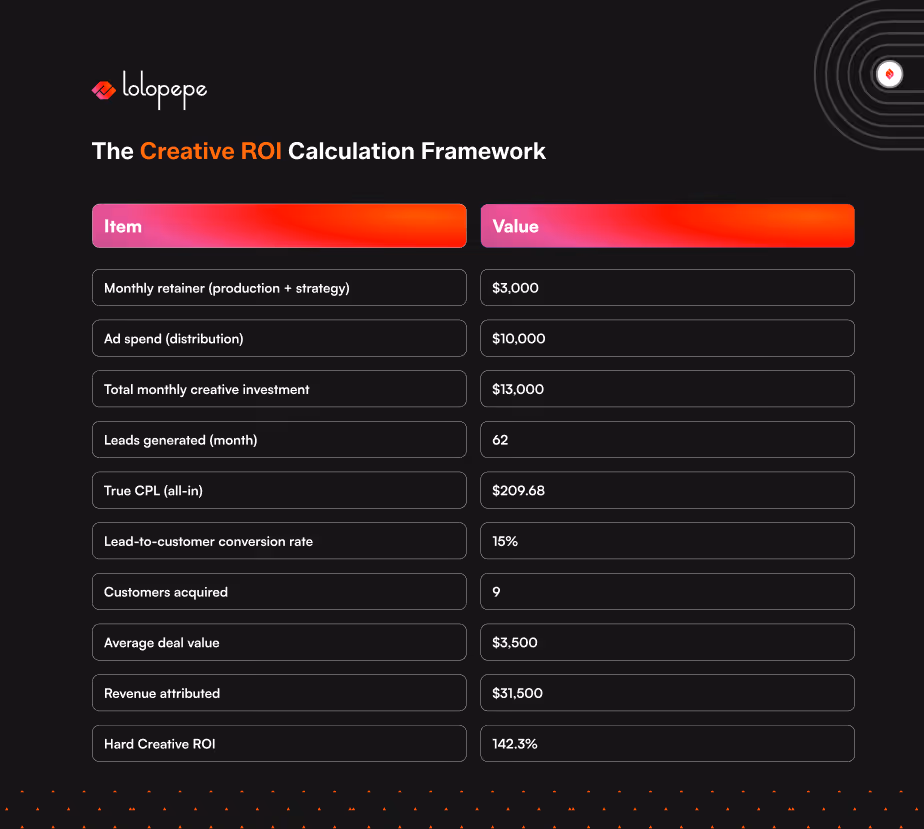
Worked Example: $3,000/Month Performance Creative Retainer
Stop hiding production invoices. Finance will find them anyway. When you present an ROI that includes the $750 trial sprint or full production costs, you aren't just showing a number - you're showing integrity. That’s how budgets get approved.
Without including the $3,000 production cost, CPL appears to be $161.29 and ROI appears to be 215%. Including it gives the defensible number. Finance will find the production invoices - include them from the start.
Adding Soft ROI: If this campaign also reduced CPL from $250 to $210 over 90 days, the annualized CPL savings = ($250 − $210) × 62 leads/month × 12 = $29,760 in recovered acquisition efficiency. Total programme ROI including soft ROI: ($31,500 + $29,760 − $13,000) / $13,000 × 100 = 370%.
Benchmarks: What Good Creative ROI Looks Like
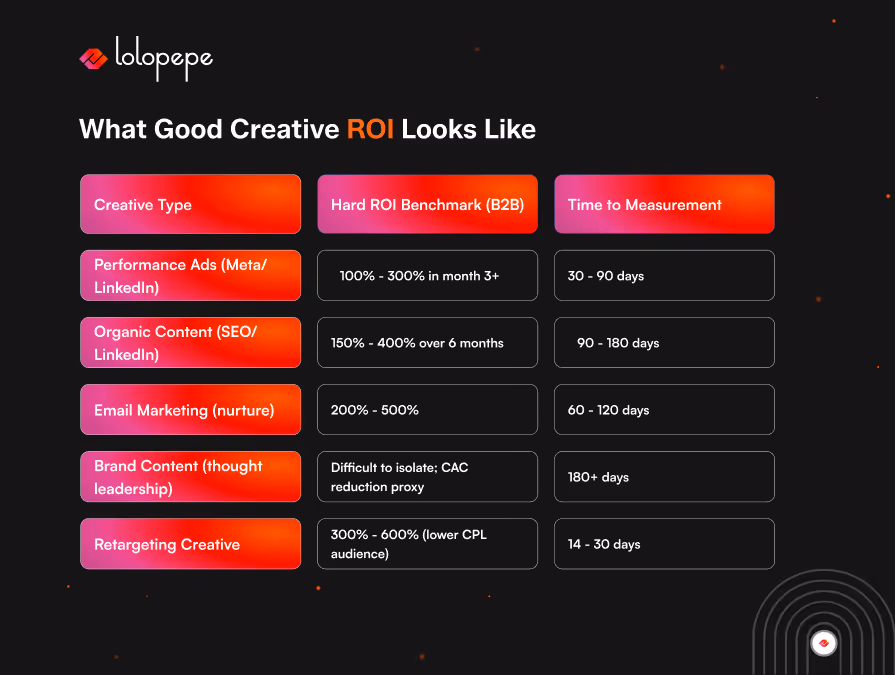
These ranges assume all-in cost calculation and 90-day attribution windows. Early campaigns will run below benchmark as the system learns - by month 3, well-structured creative programs consistently reach these ranges.
How to Present Creative ROI to a CFO
Three principles that make creative ROI defensible in a board or finance review:
Show comparison, not just absolute number. 'Our campaigns generated $200,000 in revenue at a CAC 30% below our industry benchmark' is more compelling than '$200,000 in revenue.'
Show trend, not just snapshot. One month proves nothing. Three months of consistent improvement proves a system is working. Lead with trajectory: CPL trending from $250 to $180 over 90 days is a story. A single $180 CPL month is a data point.
Show counterfactual cost. What did it cost to not have a systematic creative program? Calculate the CPL being paid under the previous model (freelancers, ad hoc agency, or internal chaos). The delta between that number and the current CPL is the ROI of the system itself - and it's often more compelling than the campaign-level numbers.
Frequently Asked Questions
What's a good ROI benchmark for B2B content marketing?
For performance creative (paid ads), 100 - 300% hard ROI by month 3 is a reasonable benchmark for well-managed B2B campaigns. For organic content, the 6-month horizon typically produces 150 - 400% when including soft ROI quantification. These assume all-in cost calculation including production - not just media spend.
How do you attribute revenue to organic content with no direct conversion?
Use first-touch attribution for organic content - credit the first touchpoint a lead encountered before entering your pipeline. Then compare close rates and deal values for first-touch organic leads versus first-touch paid leads. The difference represents the organic content contribution. Additionally: track inbound lead volume as a leading indicator; an upward trend in inbound requests that correlates with content publishing is evidence of content ROI even without direct attribution.
How long before creative investment shows measurable ROI?
Let's be honest: Brand content is usually the first thing cut in a recession because its ROI is a slow burn (180+ days). If you want to keep your budget, use CAC reduction as your proxy metric. Show the CFO that leads coming from content are cheaper to close than cold outbound. Money talks.
What's the minimum data needed to calculate creative ROI?
At minimum: total creative investment (production + distribution), total leads generated with a source tag, lead-to-customer conversion rate, and average deal value. With these four numbers you can calculate a directional hard ROI. Adding sales cycle length and multi-touch attribution data improves accuracy. Clean CRM source tagging is the single most important prerequisite - everything else is calculable from that foundation.
The Bottom Line
Creative spend is defended with a clear formula connecting production cost to pipeline and closed revenue wins - not because the numbers are always extraordinary, but because they're expressed in the language finance understands.
Build the measurement infrastructure before the next planning cycle. Tag your lead sources. Track production costs all-in. Calculate soft ROI with real numbers, not adjectives. And present trends, not snapshots.
The teams that win creative budget conversations are the ones who were already measuring before anyone asked.
Download LoloPepe's Creative ROI Calculator
A spreadsheet template that calculates Hard ROI, Soft ROI, and blended programme ROI from your actual numbers.
Stop fighting ghosts in your spreadsheets. Book a 7-Day Creative Sprint for $750 and get a performance baseline that actually makes sense to your CFO. Or, start with a 30-minute ROI Audit to see where your pipeline is leaking.
Mirhayot Yunusov
Co-Founder at Eloqwnt | LoloPepe
Mirhayot builds design infrastructure for founders who have no time for fluff. He specializes in turning subjective intuition into scalable Brand Operating Systems that empower Series B+ companies to ship daily.
Through his articles, Mirhayot shares the design thinking, strategic frameworks, and creative decisions behind building brands that look and feel like leaders. Whether it's brand systems, web design, or motion his insights are built from real work with real companies.
Subscribe to our newsletter.
Get valuable strategy, culture, and brand insights straight to your inbox.