CAC Benchmarks for B2B SaaS (And How Creative Quality Impacts Them)
Media spend is just the fuel, but creative quality is the engine's compression ratio. We dismantle the 50% CAC variance between competitors, proving how treating creative as an engineering discipline permanently lowers your customer acquisition floor.

Mirhayot Yunusov
Co-Founder at Eloqwnt | LoloPepe

The CFO’s question was direct: why is our CAC $4,200 when the benchmark for our ACV tier is $2,800?
The CMO’s response was the standard industry reflex: 'We need to spend more to earn more.' It’s the easiest lever to pull, but often the most expensive way to mask a deeper problem. Media spend efficiency is just the fuel. Сreative quality is the engine's compression ratio.
The answer was partially right and mostly incomplete. Media spend efficiency is one CAC variable. But within any ACV tier, a 30 - 50% CAC variance exists between companies with identical media budgets. The companies at the low end of that range are not spending more efficiently.
They are converting more efficiently - and the primary driver of conversion efficiency in B2B SaaS paid acquisition is creative quality.
This article provides the CAC benchmarks by ACV tier and industry segment, explains the four variables that drive CAC variance within those ranges, and makes the quantitative case for creative quality as the most underinvested CAC lever in B2B SaaS.
B2B SAAS CAC BENCHMARK SUMMARY
ACV under $5,000: CAC $500 - $1,500 | ACV $5,000 - $25,000: CAC $2,000 - $8,000 | ACV $25,000+: CAC $8,000 - $30,000+
Within any ACV tier, a 30 - 50% CAC variance exists. The primary differentiator: creative quality and testing velocity, not media spend.
How CAC Is Actually Calculated
Most B2B SaaS companies calculate CAC as: total sales and marketing spend ÷ number of new customers acquired in the period. This calculation captures the average acquisition cost but obscures the variables driving it.
A more analytically useful CAC decomposition:
CAC = (Media Spend ÷ Lead Volume) ÷ (Lead-to-Demo Rate × Demo-to-Close Rate)
Expressed as:
CAC = CPL ÷ (Lead-to-Demo Rate × Demo-to-Close Rate)
This decomposition reveals where CAC is actually being driven. A company with a $120 CPL, 20% lead-to-demo rate, and 25% demo-to-close rate has a CAC of $2,400. If CPL drops to $85 while conversion rates remain constant, CAC drops to $1,700 - a 29% reduction from creative improvement alone.
This is the mechanism by which creative quality impacts CAC: creative that produces lower CPL and higher lead-to-demo rates (because it pre-qualifies the audience more effectively) reduces CAC at every stage of the formula.
B2B SaaS CAC Benchmarks by ACV Tier
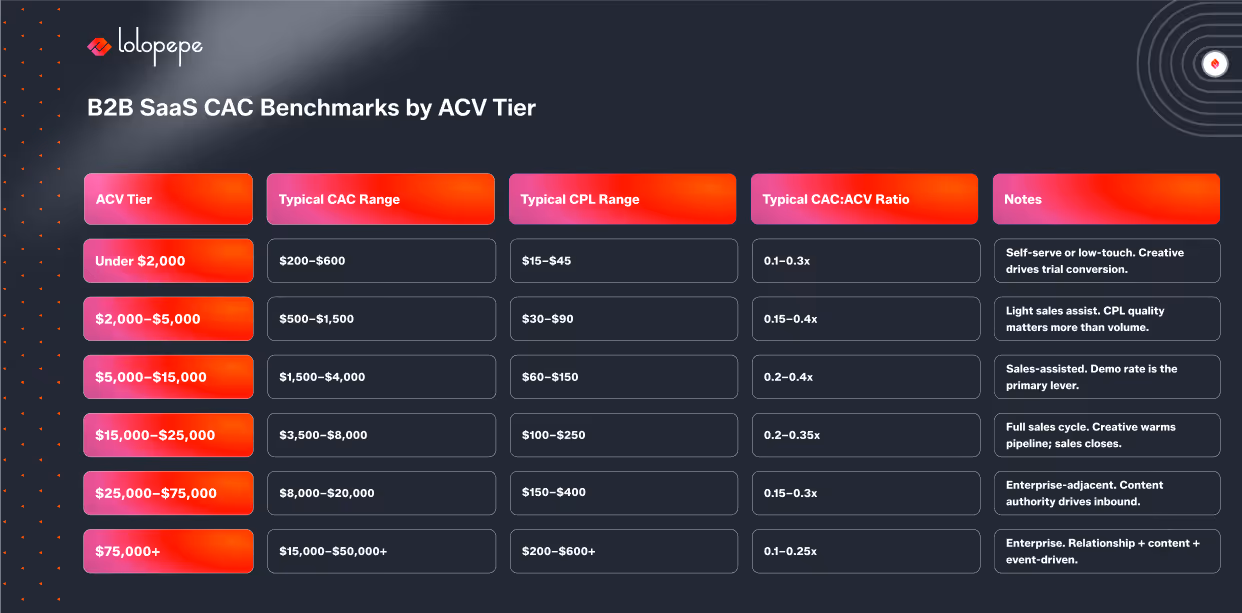
The CAC: ACV ratio is the most useful cross-company benchmark because it normalizes for deal size. A healthy B2B SaaS CAC: ACV ratio sits between 0.15x and 0.35x - meaning you spend $0.15 - 0.35 to acquire every $1.00 of annual contract value. Companies above 0.4x are acquiring customers inefficiently relative to the value of those customers; companies below 0.15x are typically either underinvesting in growth or have unusually high organic acquisition rates.
CAC Benchmarks by Industry Segment
Industry segment benchmarks have wide ranges because CAC is heavily influenced by company-specific factors: sales cycle length, ICP definition precision, channel mix, and - the focus of this article - creative quality. The ranges above represent the full distribution within each segment. Companies at the low end of their segment range are typically characterized by high creative testing velocity and systematic iteration.
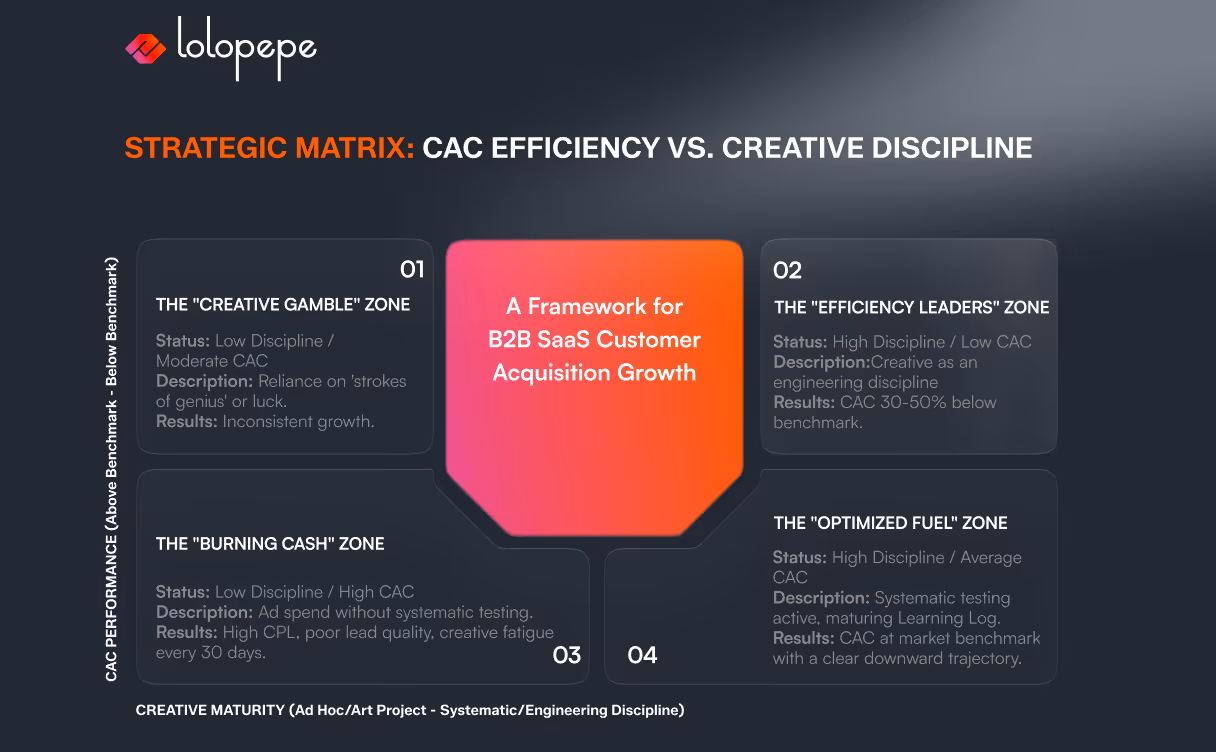
The Four Variables That Drive CAC Variance Within a Benchmark Range
1. CPL efficiency. The cost to generate a lead from paid channels. Driven by creative quality, targeting precision, and offer relevance. The highest-leverage CPL improvement lever is creative - specifically, how well the creative’s hook, angle, and proof points match the ICP’s active priorities.
2. Lead quality. The percentage of leads that are actually qualified. Generic creative is a wide net that catches too many 'tire-kickers.' You end up with a dashboard full of green lights and a sales team that’s exhausted from chasing ghosts. High-quality creative acts as a filter, not just a magnet - it should repel the wrong leads as effectively as it attracts the right ones.
3. Sales cycle length. Longer sales cycles increase CAC by adding sales cost per deal. A warm lead is the difference between a first date and an arranged marriage. When creative warms a prospect through authority content, the sales call isn't about 'who are you?'; it's about 'how do we start?'. That shift in momentum is what actually shaves weeks off your CAC payback period. A warm inbound lead - one who has encountered your content multiple times before requesting a demo - closes 20-35% faster than cold outbound at equivalent deal size.
A warm lead is the difference between a first date and an arranged marriage. Think of your CAC payback period like metabolic health. If it takes 24 months to recover what you spent today, your growth model isn't just slow - it's fragile. Creative iteration is the cardio that keeps your customer acquisition lean.
4. Close rate. The percentage of demos that convert to customers. Influenced by sales process quality, product-market fit, and prospect pre-qualification. Creative contributes to close rate through brand authority: prospects who recognize your brand as a credible authority before the demo close at higher rates than those encountering the brand for the first time on a cold outbound call.
How Creative Quality Impacts CAC: The Mechanism
Creative quality affects CAC through three channels simultaneously:
- CPL reduction: Higher-quality creative produces more efficient paid acquisition. The mechanism: a creative with a specific, resonant hook generates higher scroll-stop rates, higher click-through rates, and better-qualified leads per impression. This directly reduces CPL, which reduces the numerator in the CAC formula.
- Lead quality improvement: Specific creative pre-qualifies. An ad that says “for B2B SaaS CMOs managing + marketing budgets” will generate fewer leads than a generic awareness ad - but the leads it generates will have a higher lead-to-demo rate because the specificity filtered the audience before the click.
- Pipeline velocity: Systematic brand content - consistent LinkedIn presence, blog authority content, retargeting creative - warms prospects through multiple touchpoints before they enter the pipeline. Warm prospects close faster, reducing the denominator in the sales cost calculation.
Each of these channels is independent. Creative quality can reduce CPL without improving lead quality (if the hook is compelling but the ICP match is weak). Or it can improve lead quality without reducing CPL (if the targeting is precise but the creative requires a higher impression-to-click rate to find qualified clicks). The compounding effect occurs when all three channels are optimized simultaneously.
In SaaS, bad creative is a tax you pay every month. Systematic creative testing is a compound interest account that pays you back by permanently lowering your floor for CPL.
The Compounding Effect: What Systematic Creative Does to CAC Over 12 Months
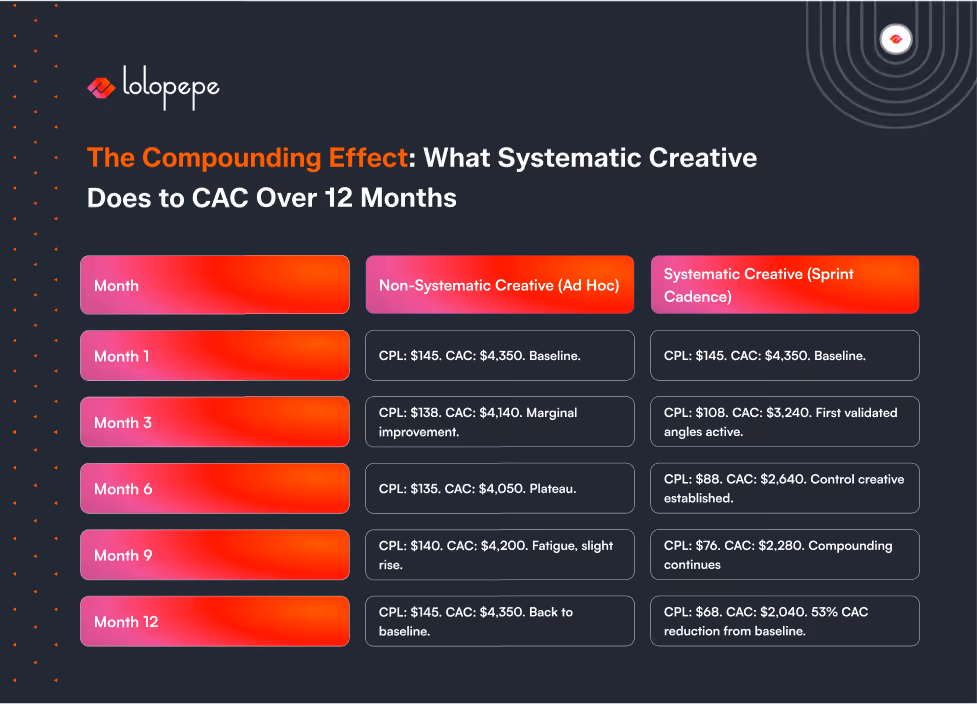
The non-systematic creative trajectory shows what happens without iteration: marginal early improvement as the team adjusts their initial creative, then a plateau as the creative fatigues and is replaced with similarly unoptimized new creative.
The systematic creative trajectory shows the compounding effect of validated learning: each sprint builds on the previous sprint’s winners, and the improvement accelerates as the Learning Log matures.
Frequently Asked Questions
Q: What is a good CAC payback period for B2B SaaS?
A: The typical benchmark for B2B SaaS CAC payback is 12-18 months for mid-market companies ($5k–25k ACV). Companies with shorter payback periods (6-12 months) typically have either high-velocity sales cycles or very efficient creative-driven acquisition. Payback periods above 24 months are a signal that either CAC is too high relative to ACV, or gross margin is insufficient to support the acquisition model. As a general rule: CAC payback should be under 2x the average contract length.
Q: How do I know if my CAC is above benchmark due to creative issues vs targeting issues?
A: Decompose the CAC formula: CPL ÷ (lead-to-demo rate × demo-to-close rate). If CPL is above benchmark but conversion rates are at or above benchmark, the problem is media efficiency or targeting - you’re paying too much per click. If CPL is at benchmark but lead-to-demo rate is below benchmark, the problem is creative pre-qualification - your creative is attracting the wrong audience. If both CPL and conversion rates are below benchmark, the problem is likely creative quality across both dimensions.
Q: How much CAC reduction can we realistically expect from improving creative quality?
A: Based on the trajectory data above and comparable client outcomes: a team moving from ad hoc creative production to a systematic sprint-cadenced iteration model can expect 25 - 40% CAC reduction within 6 months and 40 - 60% within 12 months. These ranges assume consistent sprint discipline, adequate testing velocity (10+ variants per month), and a functioning Learning Log.
The reduction comes from three compounding sources: CPL reduction (typically 30-45%), improved lead quality (typically 8-15 percentage point improvement in lead-to-demo rate), and pipeline velocity (15-25% reduction in sales cycle length for content-warmed inbound).
Q: Should creative budget be classified as a sales expense or a marketing expense in CAC calculation?
A: Include all creative production costs in the CAC denominator - whether they are classified as marketing or sales expenses internally. The most common mistake in CAC calculation is including media spend but excluding creative production cost, which understates CAC by 15 - 25% for companies with systematic creative programs. Calculated CAC without creative costs is like a recipe that omits the price of the spices. It looks cheaper on paper, but it doesn't reflect the true cost of the flavor that actually makes the customer buy.
Are you modeling creative quality as a variable in your spreadsheets, or are you still treating it as a fixed overhead that has no impact on the bottom line? A fully-loaded CAC includes: media spend + creative production cost + content production cost + marketing team compensation attributed to acquisition activities + sales team compensation.
The Bottom Line
If your CAC is above the benchmark for your ACV tier and industry segment, media spend is rarely the primary culprit. The first place to look is the creative quality variable - specifically, whether your creative is systematically tested and iterated, or whether it is produced ad hoc and replaced when it stops working.
The 30 - 50% CAC variance within any ACV tier benchmark range is not random. The 50% CAC variance isn't luck. It’s the dividend paid to companies that stop treating creative like an 'art project' and start treating it like an engineering discipline.
Download the B2B SaaS CAC Benchmark Report - full benchmark tables by ACV tier and industry segment with CAC:ACV ratio analysis.
Book a CAC Audit - benchmark your current acquisition cost and identify the creative variable’s contribution for $750.
Mirhayot Yunusov
Co-Founder at Eloqwnt | LoloPepe
Mirhayot builds design-led ventures that make impact. He specializes in turning subjective intuition into scalable Brand Operating Systems that empower Series A+ companies to ship daily.
Through his articles, Mirhayot shares the design thinking, strategic frameworks, and creative decisions behind building brands that look and feel like leaders. Whether it's brand systems, web design, or motion his insights are built from real work with real companies.
Subscribe to our newsletter.
Get valuable strategy, culture, and brand insights straight to your inbox.